 English
 Français
 Español
 Bahasa Indonesia
 中文 (中国)
 Русский
 Português
 Deutsch
Table of Contents
The Ichimoku Kinko Hyo, which translates to Equilibrium at a Glance Chart, separates higher probability trades. It is relatively new to the public but is gaining traction with newcomers and expert traders. The Ichimoku indicator, well-known for its usage in financial markets, displays more data points, resulting in more dependable price behavior.
Goichi Hosoda & the Equilibrium Chart

The Ichimoku indicator was created and developed by Japanese journalist Goichi Hosoda (1898-1982) in the 1930s. Still, it took him and his team over 20 years to finally showcase their research to the public in the late 1960s.
Apparently, Goichi wanted to develop an “all in one” indicator to help him analyze and view charts faster and in more detail.
The advantages of the Ichimoku indicator include anticipation of entry and exit points; flexibility of time frame; functionality on any type of market (including crypto); simple formulas; a system that is autonomous, easy, and adjustable, shows the future zones of resistance and support, as well as busy areas for past-present-future; and much more.
Ichimoku’s Graphic Environment: Key Elements
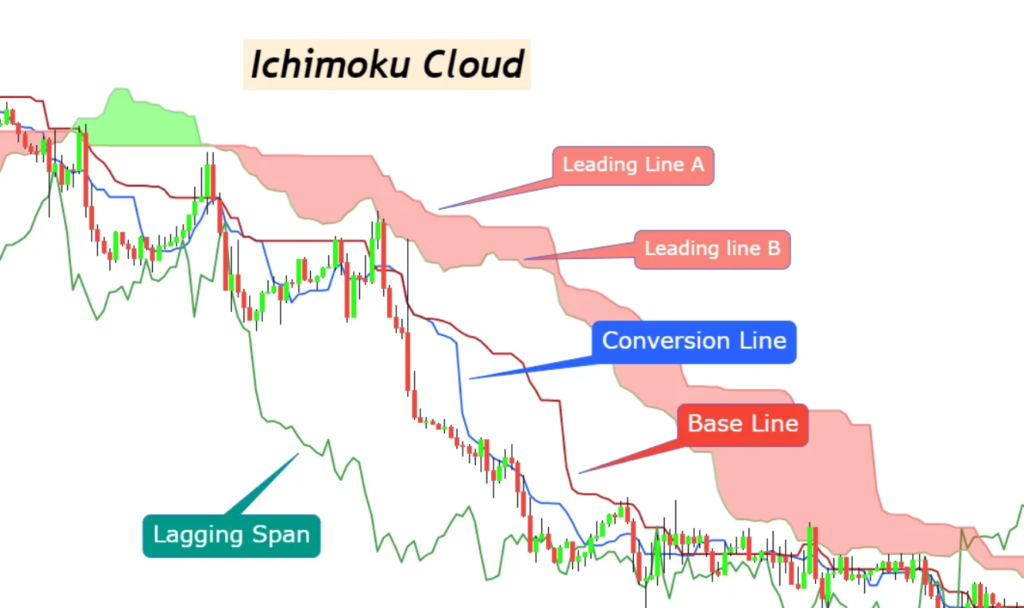
The Ichimoku Environment also referred to as the Ichimoku Cloud, is a set of technical indicators that reflect the financial or crypto markets’ overall strength and direction. Basically, it is a chart that plots multiple averages. The data is then used to generate a cloud that predicts where a cryptocurrency’s price might find support or resistance in the future. Mastering the Ichimoku system will allow you to make high-probability decisions much faster. Now, let’s look at its main elements.
Tenkan Sen (Conversion Line)
The conversion line shows the midpoint of the lowest low and highest high in the span of 9 days. It is generally used to estimate short-term momentum and is viewed similarly to a short-term moving average.
If the line is sharply slanted, it denotes a significant price change or strong momentum, whereas a flatter indicates the opposite (the momentum is low or nonexistent). The price breaching through this Ichimoku Kinko Hyo Line may be an early indicator that a trend will change.
Kijun Sen (Base Line)
This element indicates the average of the lowest low and the highest high within the last 26 days. The data it provides is similar to that of the Conversion Line, but it is considered more reliable since it is calculated over a more extended period of time.
A flat Base Line would show the range’s vertical midpoint if the prices were fluctuating. On the other hand, it will angle up or down to show if the price has surpassed the highest high or lowest low in the last 26 days. So, its direction can be used to determine a short-term trend.
Chikou Span (Lagging Span Line)
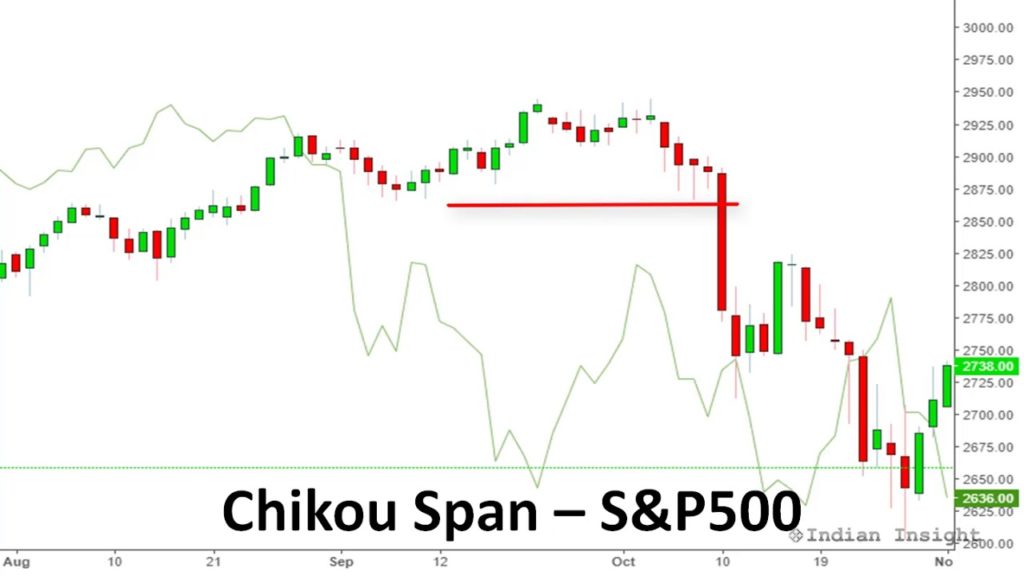
This line refers to the closing price. And as the name suggests, it lags after the price and showcases what it was 26 days prior.
When this line is above the closing prices, the trend is considered upward, while when the line is below, it is downward.
Senkou Span A (Leading Span A)
It is the faster-moving boundary of the two lines that encompass the Ichimoku Cloud. Leading Span A is the midpoint (or moving average) of the Base and Conversion lines and is plotted 26 periods into the future.
Senkou Span B (Leading Span B)
Leading Span B is considered to be the slower of the above two lines that create the borders of the Cloud in the Ichimoku system. Although it is also plotted 26 periods in the future, unlike its counterpart, Leading Span B is the moving average of the lowest lows and highest highs within the last 52 trading days.
How to Trade with Ichimoku Cloud
The most notable part of the Ichimoku Kinko Hyo is the Kumo or Cloud. Situated between the Leading Spans A and B, it allows the user to immediately identify the current “big picture” trend and its relation to the price.
After finding the two boundary lines, you can shade in the Cloud. If the Leading Span (LS) A is under the LS B, the Cloud should be shaded red, as the crypto asset is moving in a negative direction. However, if LS A is above, the cryptocurrency’s price is gaining momentum, so the Cloud should be green.
The initial settings of the Ichimoku system are 9-26-52 (based on the previous Japanese working week). However, considering that the crypto market is open 24/7, some users adjust it to 10-30-60 (or 20-60-120 for fewer miscalculations).
Final Thoughts
The relatively simple system and adjustable settings of the Ichimoku Indicator make it useful for beginners and expert traders. Although it has some downsides due to historical data usage in its predictions, you should use it with other indicators to reduce the risks associated with crypto trading, and staking.
Disclaimer: The opinion expressed here is not investment advice – it is provided for informational purposes only. It does not necessarily reflect the opinion of EGG Finance. Every investment and all trading involves risk, so you should always perform your own research prior to making decisions. We do not recommend investing money you cannot afford to lose.